Transform Your Marketing Data into Actionable Business Insights
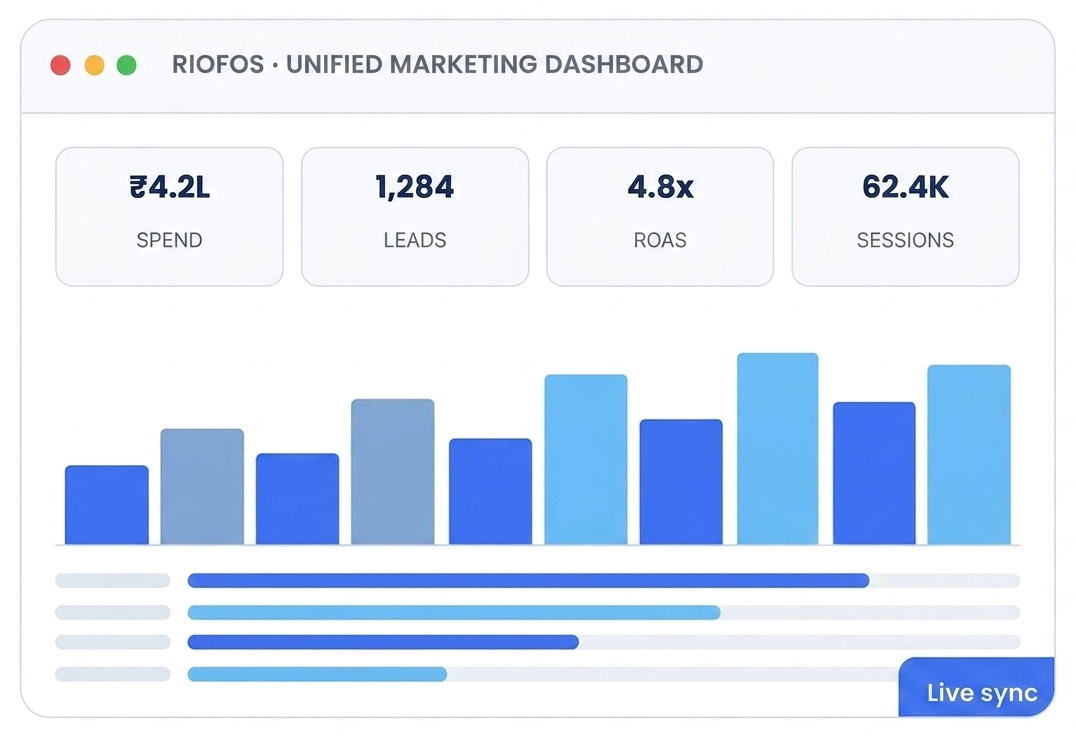
Stop switching between multiple marketing platforms. The Riofos Marketing Reporting Platform brings your Google Ads, Meta Ads, Google Analytics 4 and Google Search Console data together into one intelligent dashboard — so you can measure performance, monitor ROI and make faster business decisions.
Managing multiple advertising platforms is exhausting. Marketing teams routinely lose hours every week exporting spreadsheets from Google Ads, downloading Meta Ads reports, checking GA4 and then pulling Search Console data — only to end up with numbers that never quite line up. By the time the report is ready, the campaign has already moved on.
Riofos has developed a centralised, secure Marketing Reporting Platform that automatically collects data from every connected marketing channel and turns it into interactive dashboards and easy-to-understand reports. There is nothing to install and no spreadsheet to maintain — you authorise your accounts once and the platform keeps itself up to date.
Whether you are running performance marketing, SEO campaigns, or simply monitoring website performance, the platform gives your business one unified source of truth — the same numbers on the same screen for your marketing team, your agency and your leadership.
Google Ads, Meta Ads, GA4 and Google Search Console
Automated sync — no exports, no copy-paste, no version confusion
The same numbers for your team, your agency and management
Automated data synchronisation keeps every chart current, so you are always looking at the latest campaign performance rather than last week's export.
See the KPIs leadership actually asks about: spend, conversions, leads, ROAS, website traffic, keyword rankings and engagement — on a single screen.
Monitor your entire digital marketing ecosystem — paid search, paid social, website analytics and organic search — without switching between four different logins.
Go beyond raw numbers. Performance trends, period-on-period comparisons and clear recommendations show you what to fix and what to scale.
Your data stays protected through authorised account integrations, secure authentication and role-based access for every user you invite.
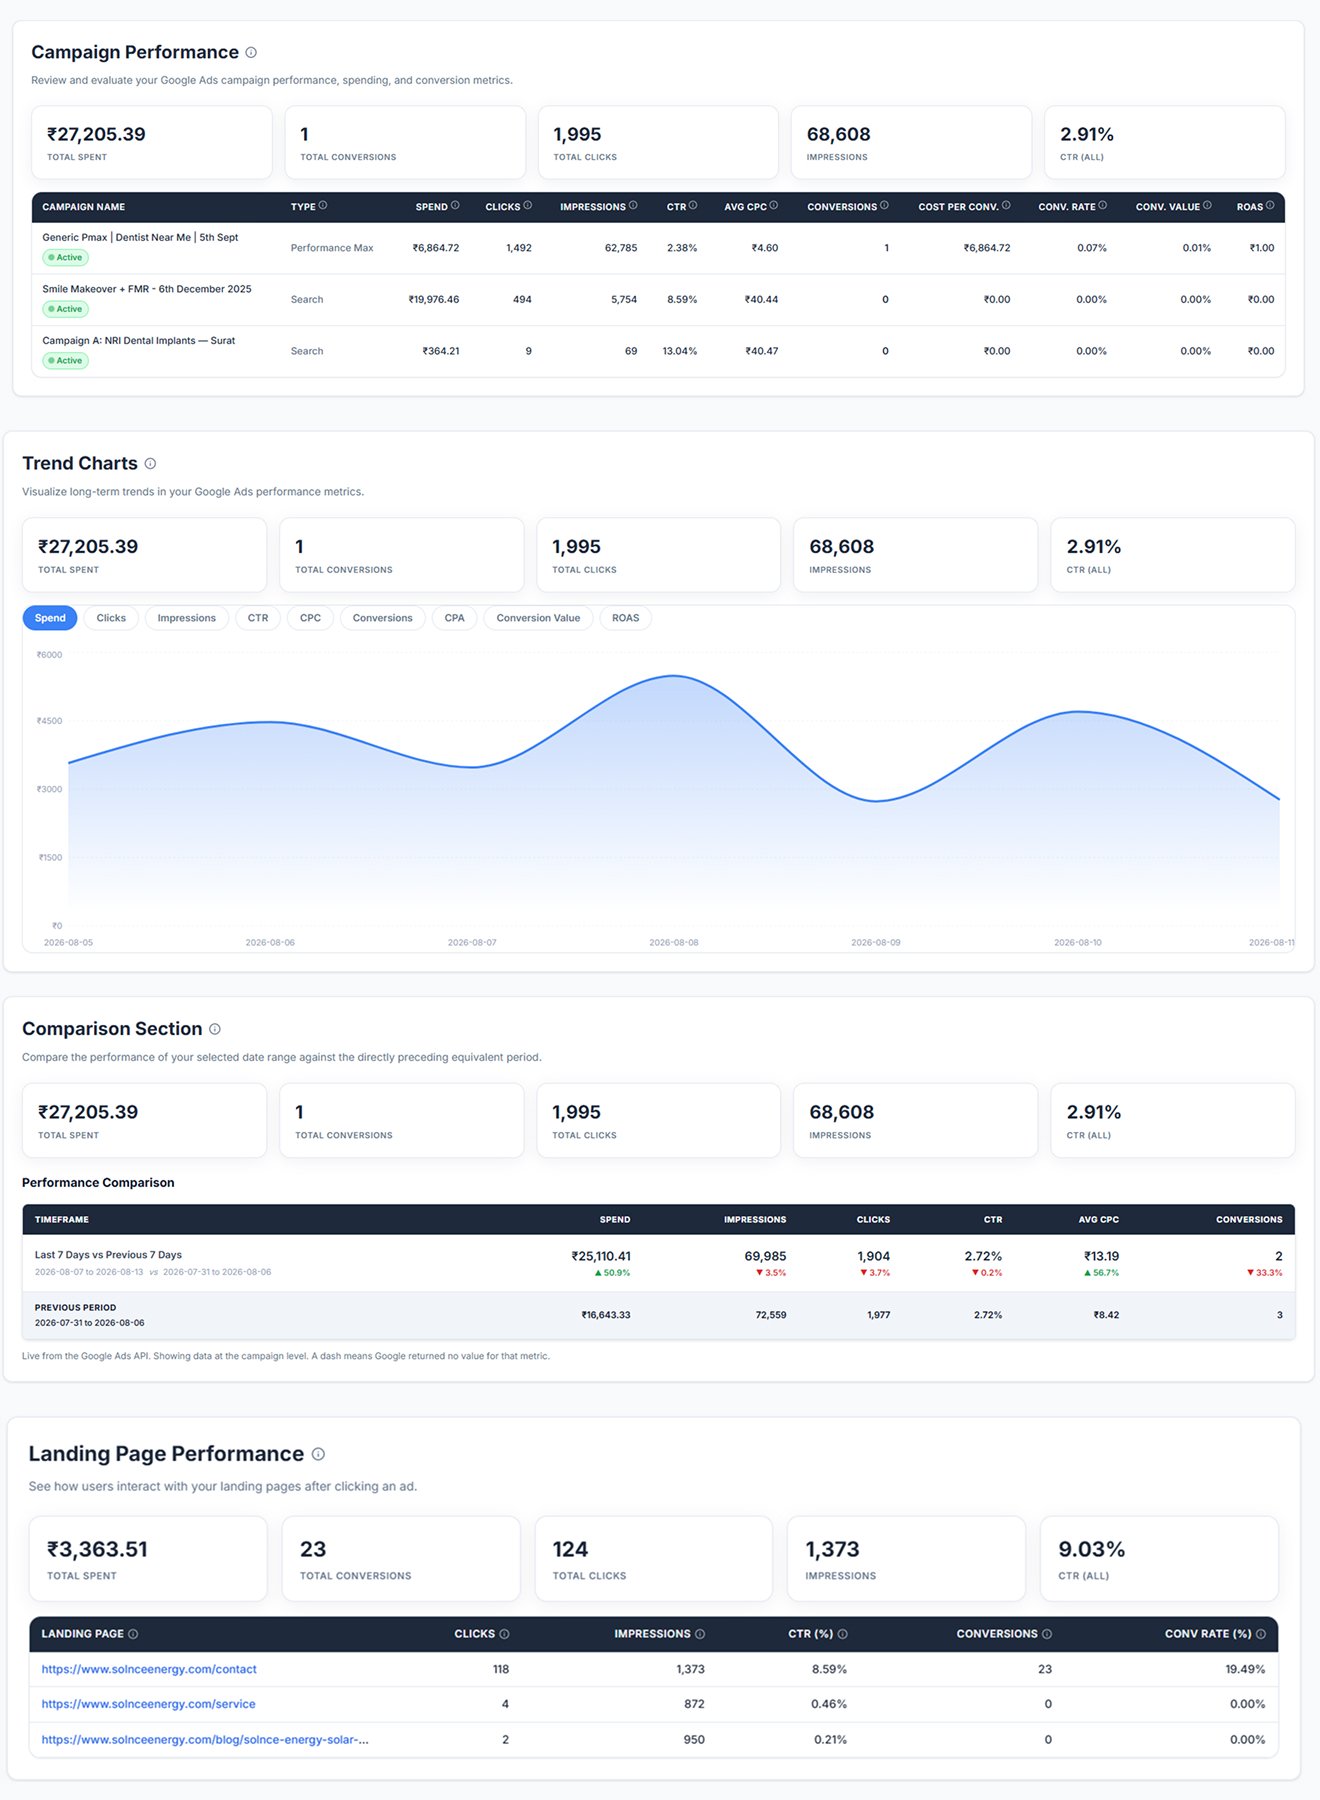
Paid search & shopping performance
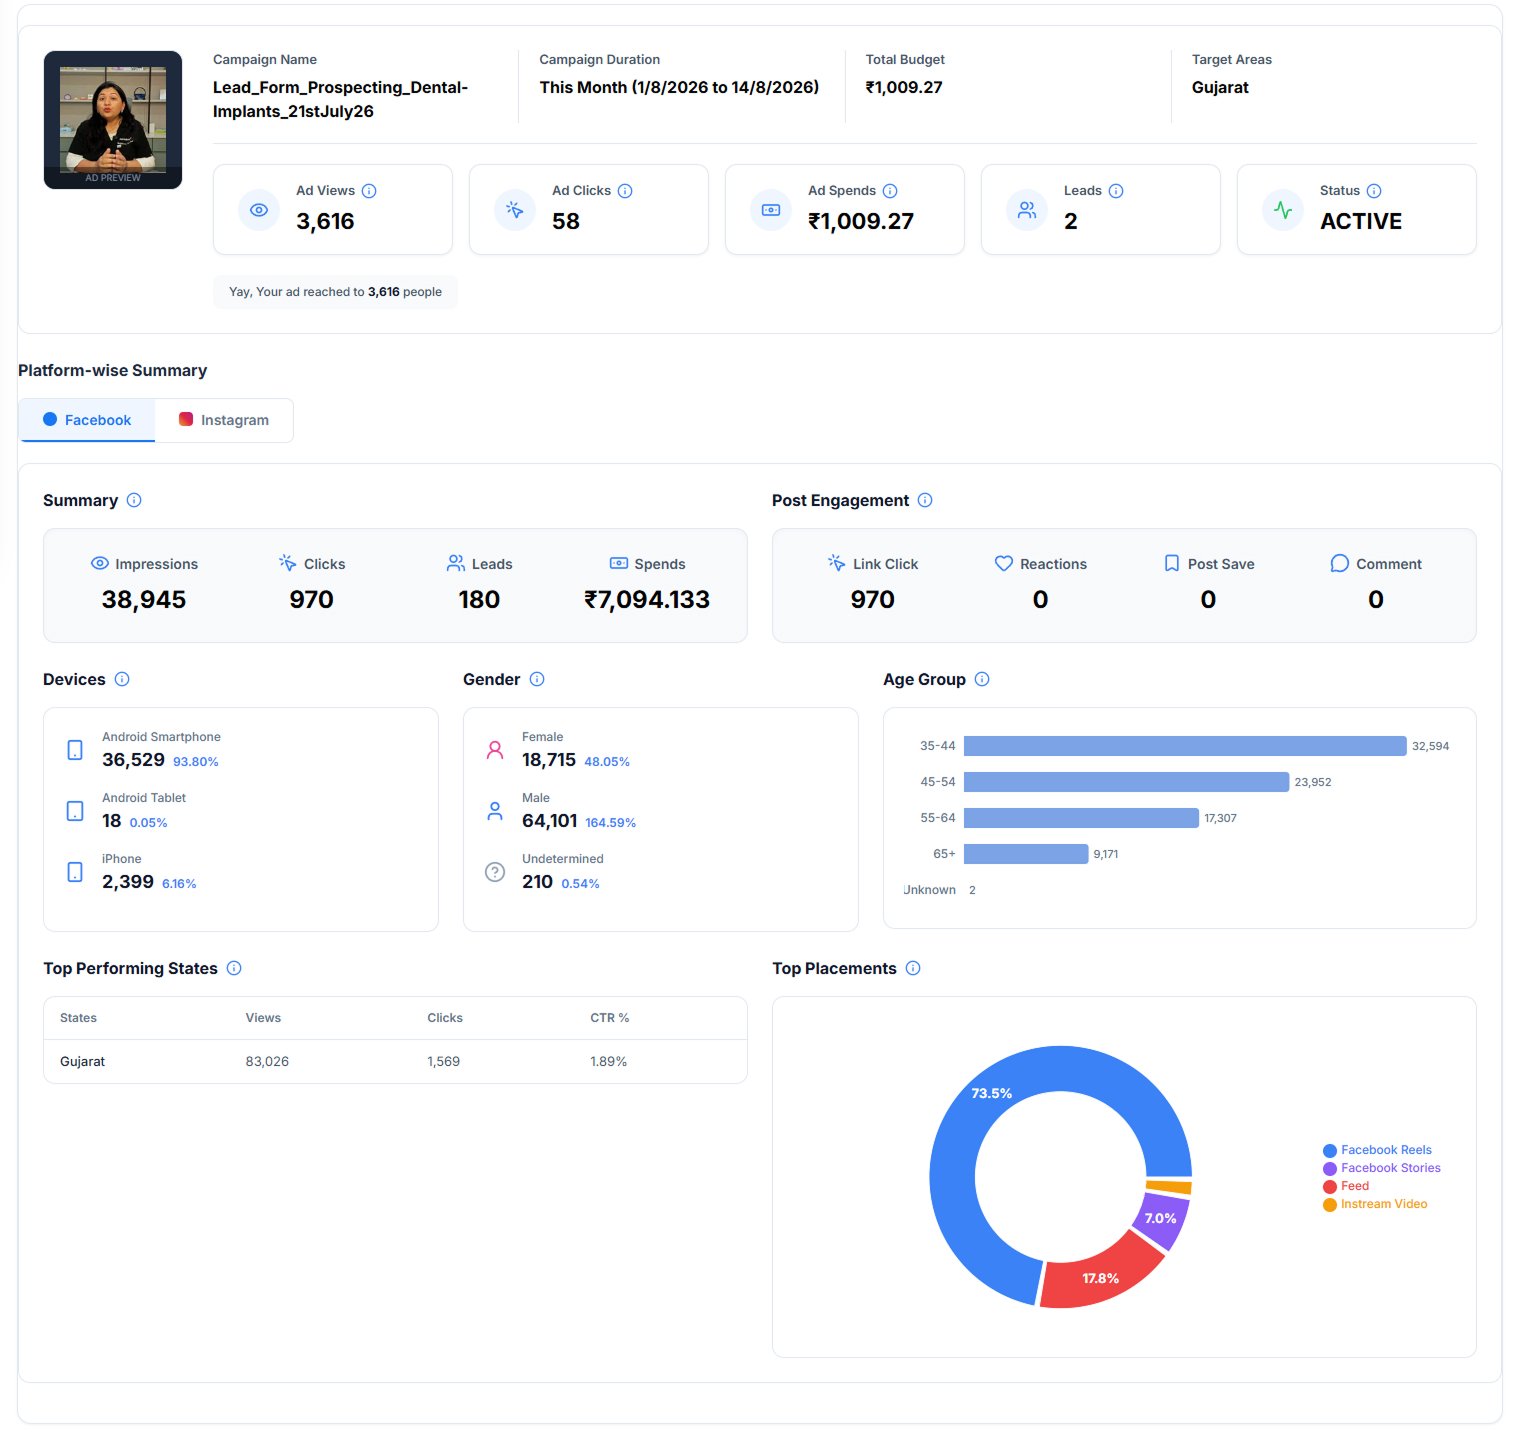
Facebook & Instagram advertising
Website traffic & conversions
Organic search & SEO visibility
Spend, clicks, conversions and ROAS per campaign
Which ad groups earn their budget
Cost and conversions per keyword
Real queries — new keywords and negatives
Reach and demand volume over time
Ad copy performance at every level
What you actually pay per click, trended
True acquisition cost per lead or sale
Forms, calls, purchases and sign-ups attributed
Return on ad spend at every level
Daily and monthly pacing vs budget
Mobile vs desktop vs tablet results
City, state and country level results
Any two campaigns or date ranges side by side
Day-by-day spikes, drops and weekday patterns
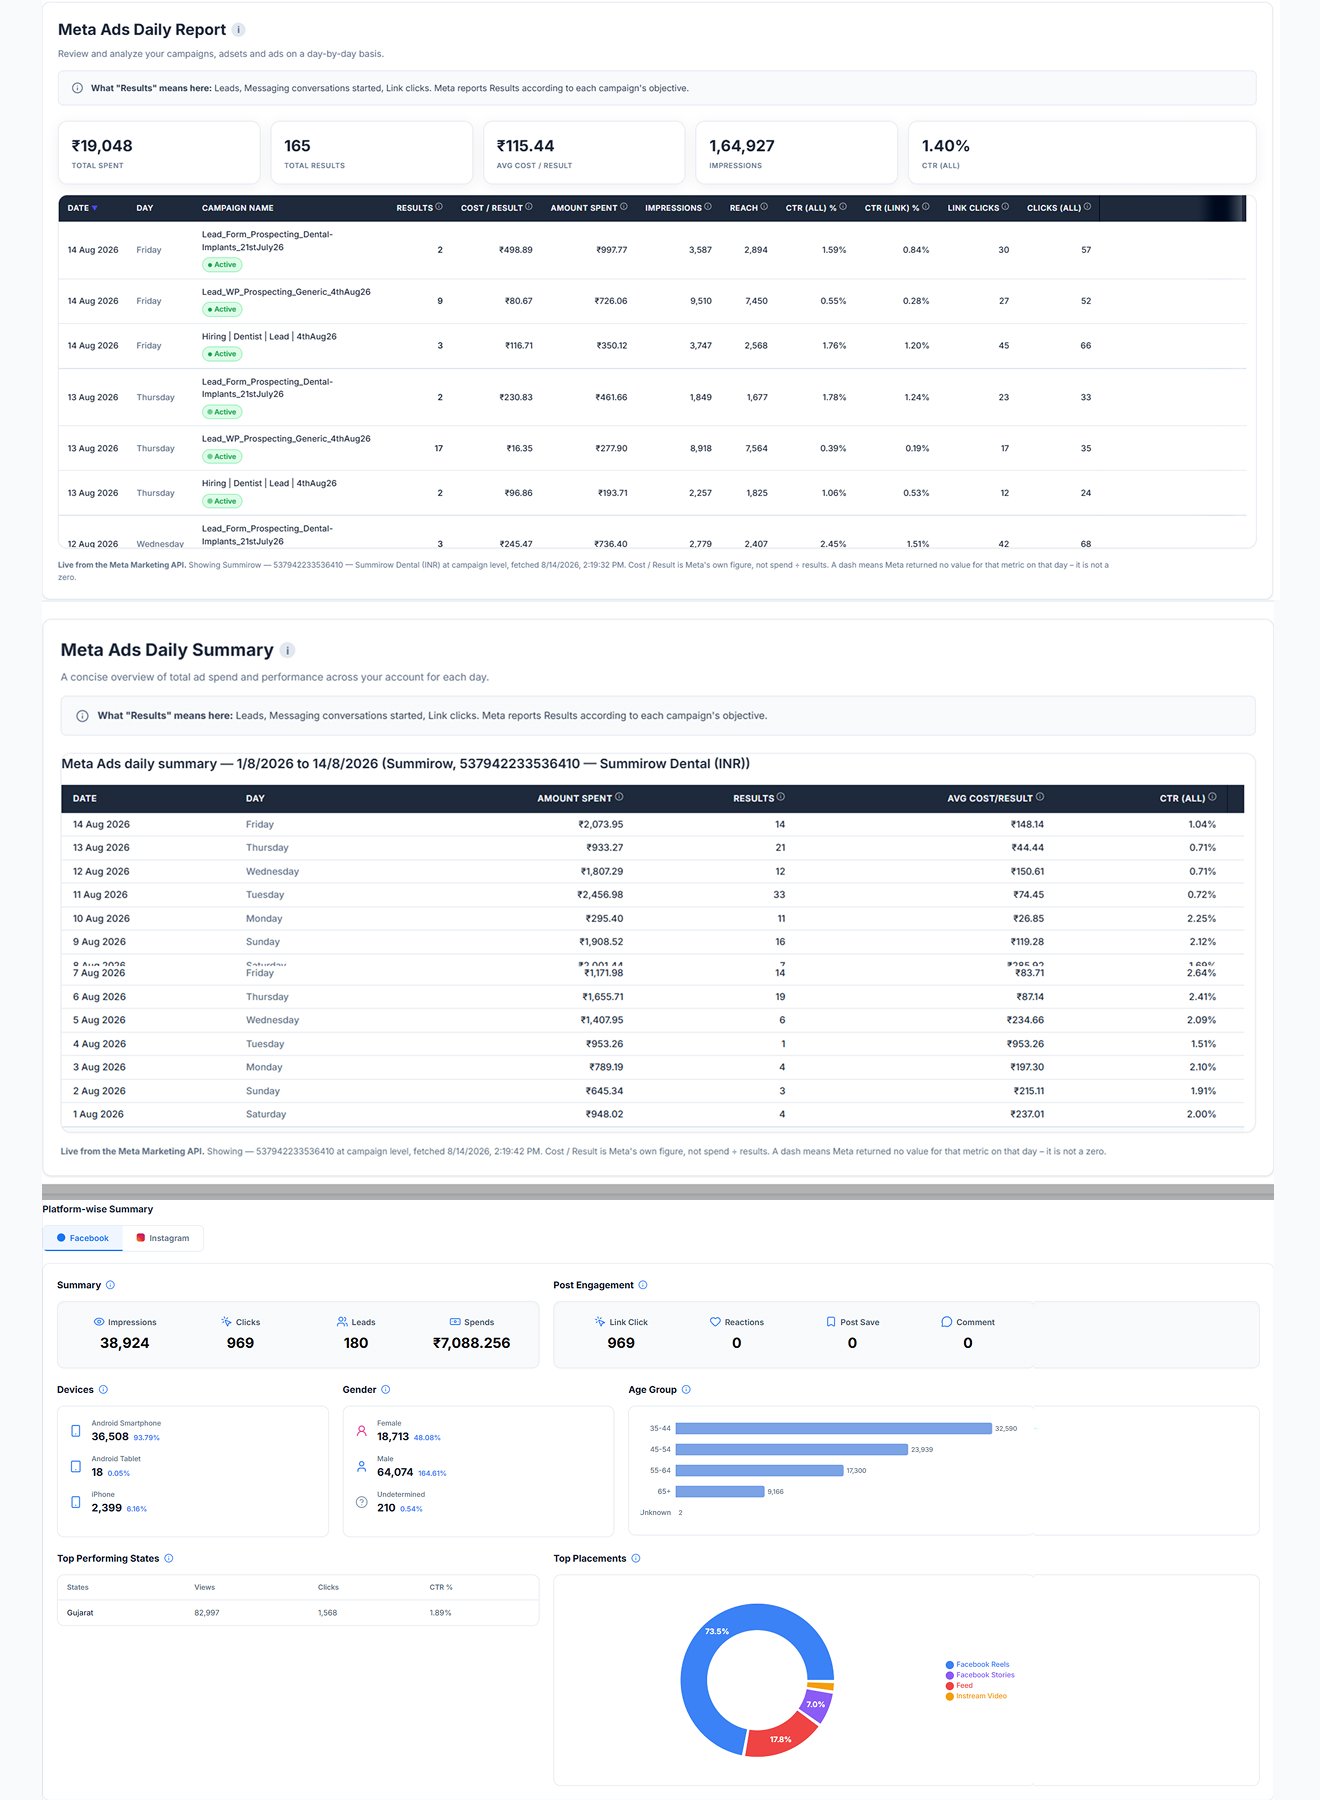
Spend, results and cost per result
Budget, audience and optimisation results
Which images, videos and carousels win
Unique people reached, plus frequency
Cost per thousand impressions, trended
Cost per click across campaigns and creatives
Early indicator of creative quality
Pixel and CAPI conversion events
Cost of the objective you optimised for
Return on ad spend for purchase campaigns
Saved, custom and lookalike comparison
Feed vs Stories vs Reels vs Audience Network
Demographic breakdown of results
React to fatigue or cost spikes in hours
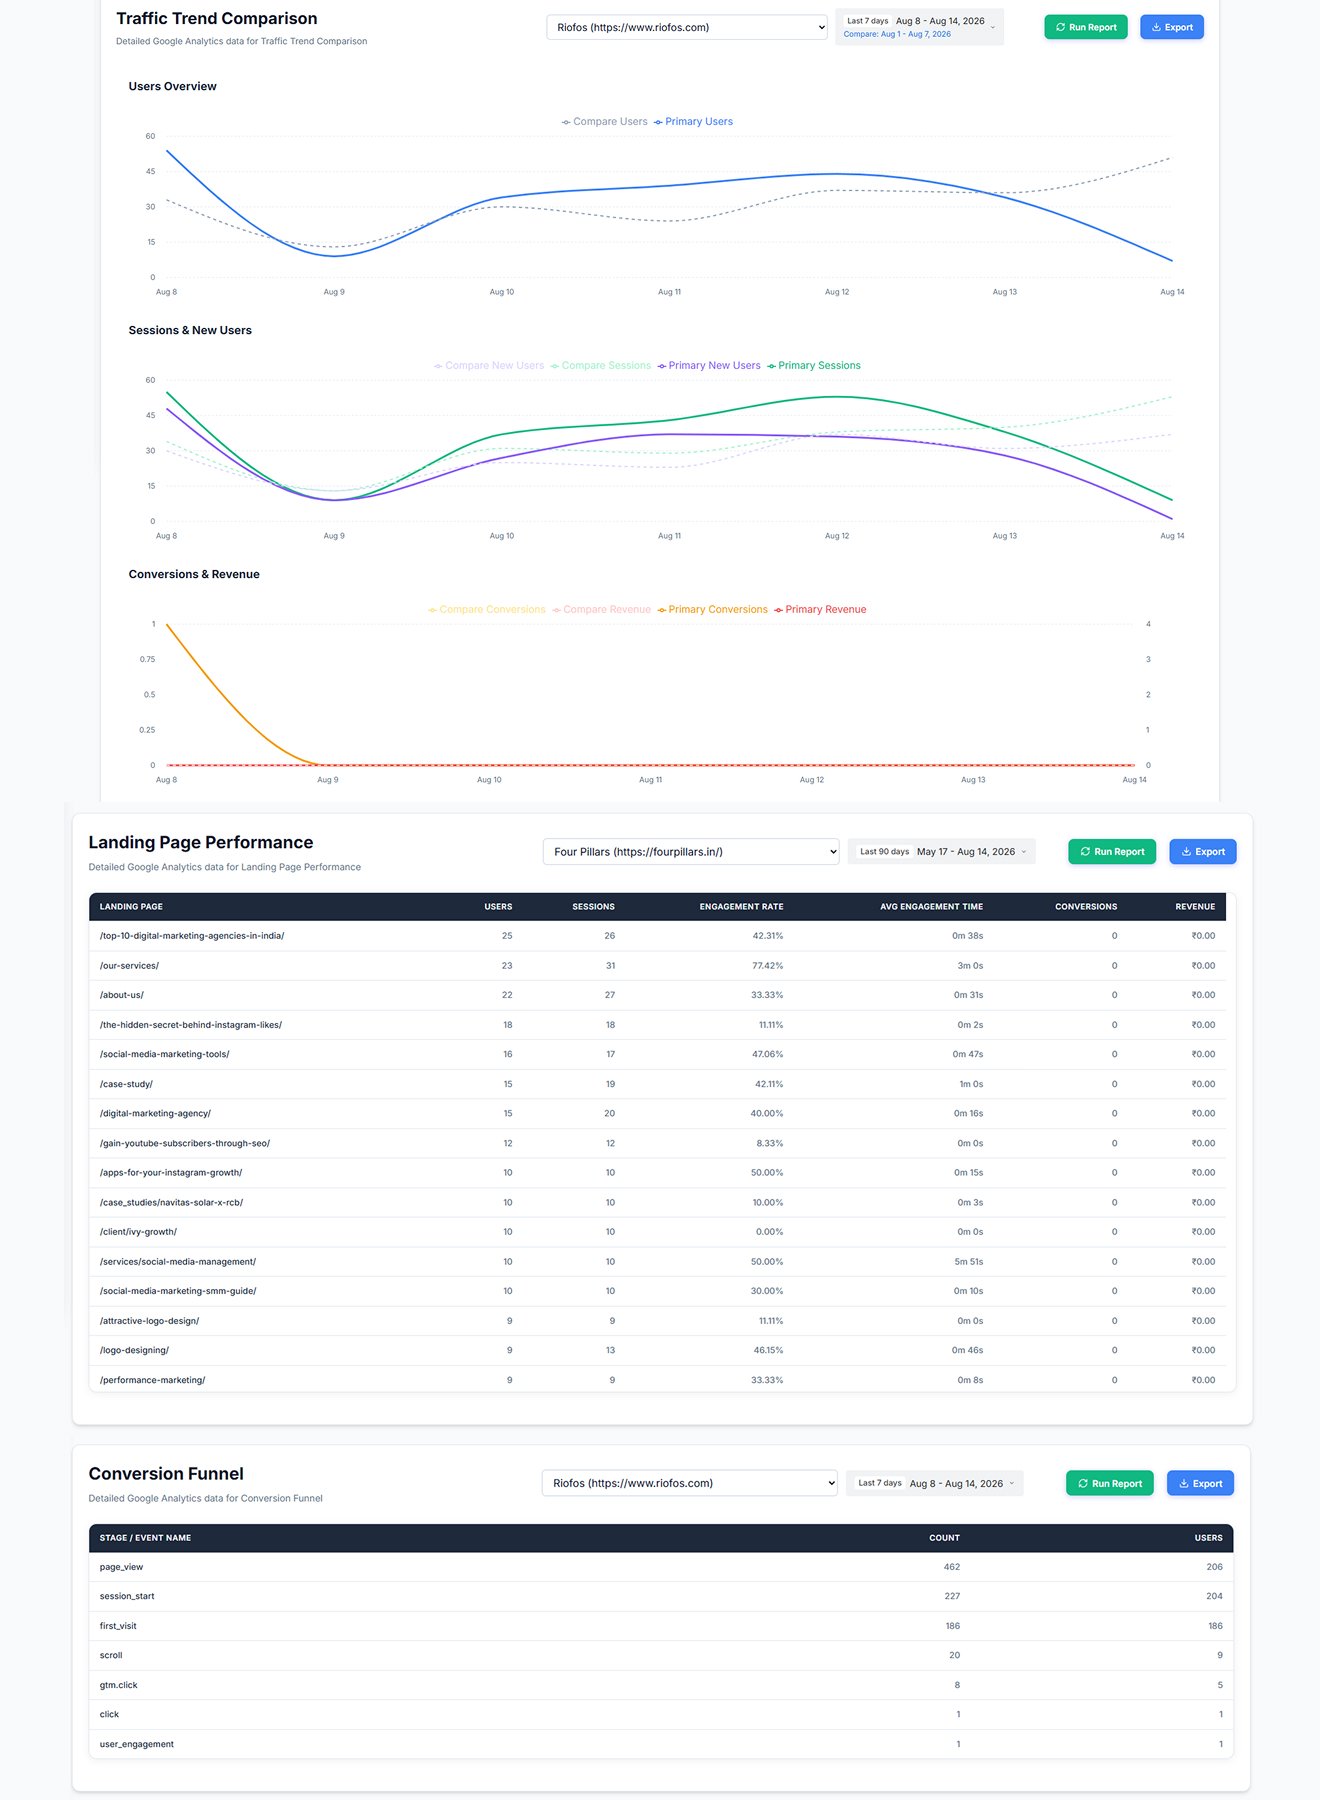
Total and returning users, with period comparison
Visit volume tracked against your campaigns
Your top-of-funnel growth signal
Genuinely engaged visits, not bounce rate
How long visitors stay with your content
Entry pages ranked by traffic and conversions
Organic, paid, direct, referral, social, email
Compare SEO vs paid vs social fairly
Mobile, desktop and tablet conversion gaps
Country, state and city breakdown
Key events mapped back to their channel
Revenue, transactions and average order value
The paths visitors take — and where they exit
Clicks, form starts, video plays, scroll, downloads
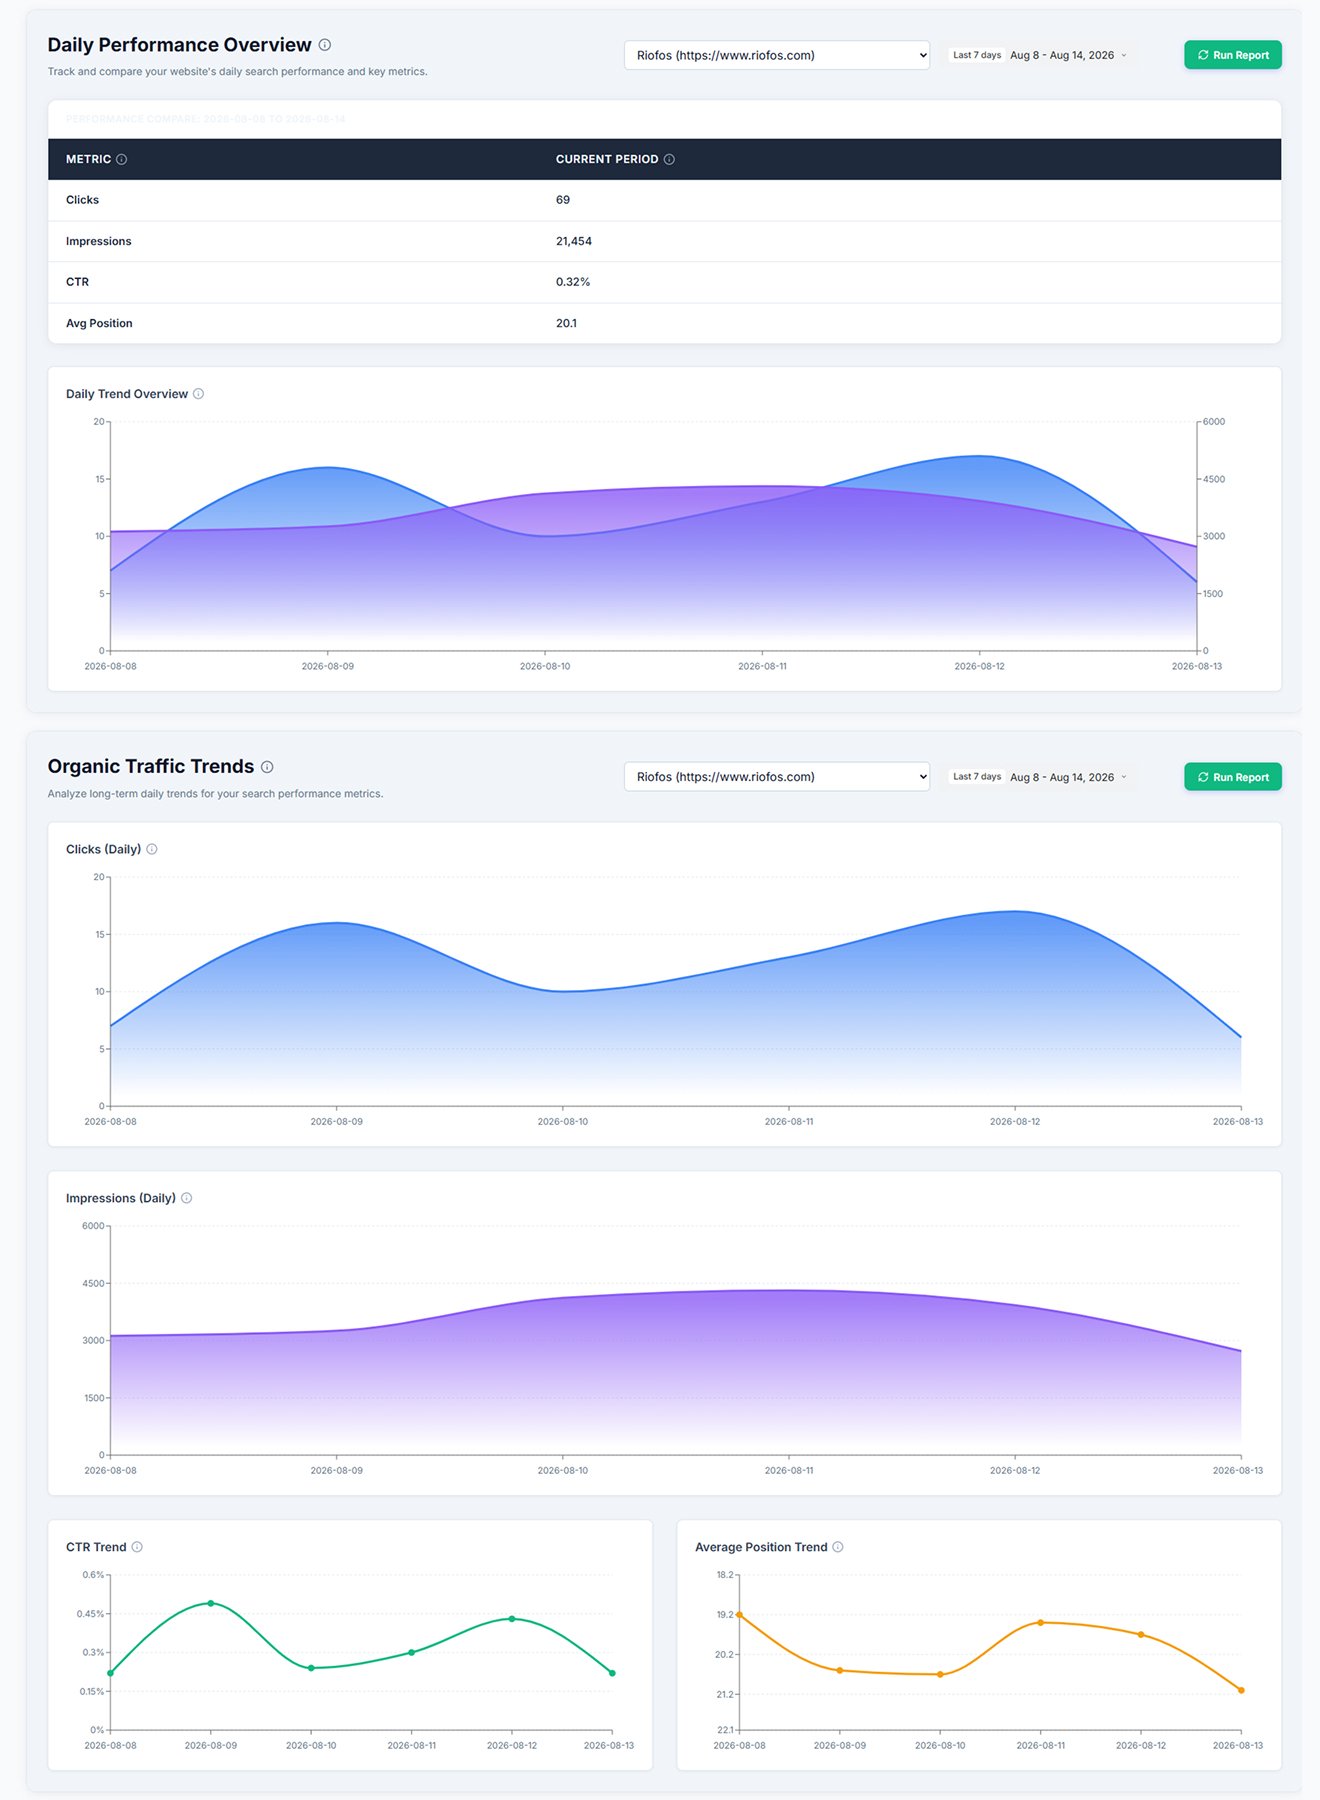
Non-paid Google Search traffic, trended
How often your pages appear in results
By keyword, page, country and device
Where a better title would win traffic instantly
Queries driving your clicks and impressions
What gained or lost position since last period
Which content earns and which needs work
Desktop vs mobile ranking gaps
Organic visibility per market
Rich results, FAQs, sitelinks and videos
What is indexed, what is excluded, and why
LCP, INP and CLS grouped by URL status
Crawl errors and indexing drops as they appear
Long-term growth beyond the 16-month limit
Bring all your marketing data together in one powerful dashboard. Individual platform reports tell you how a channel performed. The executive dashboard tells you how the business performed.
View Everything in One Place
No more downloading reports from multiple platforms, reconciling mismatched numbers,
or rebuilding the same slide every month. Access everything from one centralised dashboard — on any device, at any time.
Generate daily, weekly and monthly marketing reports automatically and have them ready before your review meeting starts.
Always view the latest campaign performance — dashboards refresh on schedule so nobody presents stale numbers.
Get notified about unusual traffic movements, campaign status changes, budget overruns or sudden drops in conversions.
Manage several brands, locations or client accounts from one login, each with its own isolated view.
Interactive charts, trendlines and comparison views that make complex marketing data readable in seconds.
Compare SEO, paid search, paid social and website performance side by side on the same time axis.
Role-based permissions let you decide exactly what your team, agency partners and stakeholders can see.
Nothing to install. Access your reports from desktop, tablet or mobile, anywhere, any time.

| What you're comparing | Manual / spreadsheet reporting | Riofos Reporting Platform |
|---|---|---|
| Time per monthly report | 6–10 hours of exporting and formatting | Ready automatically, reviewed in minutes |
| Data freshness | As old as the last export | Synced automatically, near real-time |
| Cross-channel view | Four separate files that rarely reconcile | One dashboard, one set of numbers |
| Human error | Copy-paste and formula errors are common | Data pulled directly from platform APIs |
| Historical comparison | Depends on someone having saved the file | Full history retained and always comparable |
| Access control | Files emailed around with no control | Role-based permissions per user |
| Alerts | You find out at month end | Notified when something moves unexpectedly |
| Multiple brands / locations | One spreadsheet per brand | All accounts in a single login |
Already working with Riofos on SEO, performance marketing or website development? The reporting platform plugs straight into your existing engagement.
The platform supports Google Ads, Meta Ads (Facebook and Instagram), Google Analytics 4 and Google Search Console, combining all four into a unified marketing performance dashboard.
Dashboard data is synchronised automatically to provide near real-time reporting. Exact refresh timing depends on each platform’s own API data availability — Google Ads and Meta Ads update through the day, while Search Console data follows Google’s standard reporting delay.
Yes. The platform supports multiple connected accounts under a single login, which makes it ideal for businesses with several brands or locations, and for agencies managing multiple clients.
Yes. We only access data from accounts that have explicitly authorised Riofos. Access is protected through secure authentication and role-based permissions, and you can revoke access at any time from your own platform account.
Yes. Reports can be exported and shared with your team or stakeholders for regular performance reviews, and scheduled reports can be delivered automatically.
No. The dashboards are designed for business owners and marketing managers. If you can read a chart, you can use the platform — and our team walks you through your first review.
The platform is available to Riofos clients as part of their engagement, and separately to businesses that want reporting only. Request a demo and we will recommend the right option.
Most accounts are connected and live within a few working days, depending on how quickly account access is authorised.