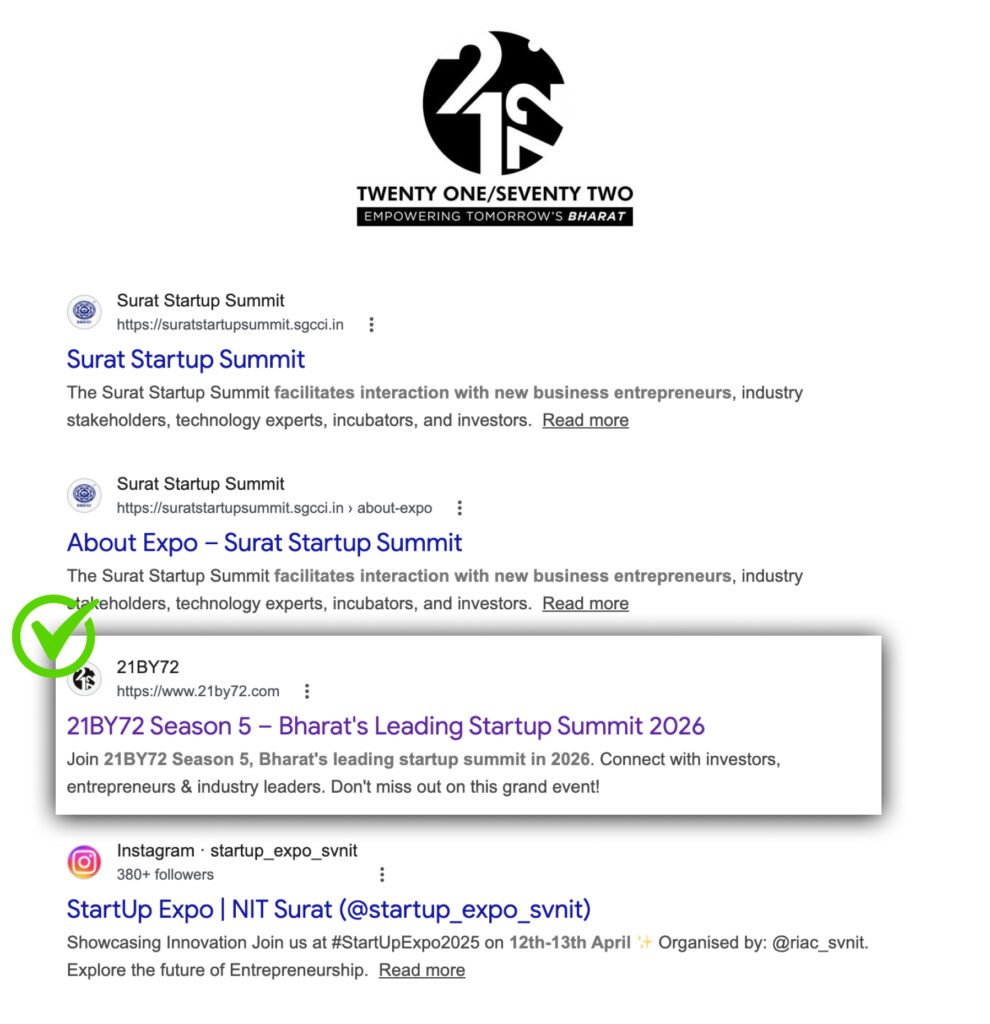
21BY72 Season 5 Final Business Report: ₹35L+ Revenue & 4.78x ROAS
Consolidated performance of the 21BY72 Season 5 campaign across website ticketing, exhibitor stalls and Meta advertising. All revenue figures are gross amounts collected from customers.
The Headline Numbers
Consolidated performance across website ticketing, exhibitor stalls and Meta advertising for the 21BY72 Season 5 campaign.
Website Orders Summary
Gross sales from all 397 completed ticket orders placed through the 21BY72 website, product-wise.
| Product Type | Quantity Sold | Gross Revenue |
|---|---|---|
| Exhibition & Panel Discussion Pass | 248 | ₹5,34,781 |
| Investor Pass | 111 | ₹4,69,925 |
| Dual Occupancy | 28 | ₹2,51,134 |
| Panel Discussion Pass | 130 | ₹2,61,324 |
| Triple Occupancy | 5 | ₹64,260 |
| Weekend Address Room | 3 | ₹20,060 |
| GRAND TOTAL | 525 | ₹16,01,484 |
Website Organic Lead Enquiries
On-site enquiry leads captured through the website forms during the campaign — 1,910 in total across three product lines.
| Lead Type | Leads | Share |
|---|---|---|
| Total Tickets | 1,627 | 85.2% |
| Total Stalls | 197 | 10.3% |
| Total Hotel Booking Rooms | 86 | 4.5% |
| GRAND TOTAL | 1,910 | 100% |
Confirmed Exhibitors Summary
Stall sales across Platinum, Gold and Silver tiers.
| Stall Type | Stalls Sold | Gross Revenue |
|---|---|---|
| Platinum Stall (P1) | 9 | ₹6,22,450 |
| Gold Stall (G1) | 8 | ₹4,60,200 |
| Silver Stall (S1) | 19 | ₹8,26,000 |
| GRAND TOTAL | 36 | ₹19,08,650 |
Meta Ads Performance Summary
Performance across 44 Meta campaigns on Facebook and Instagram during the campaign period.
| Campaign Type | Campaigns | Spend | % | Leads |
|---|---|---|---|---|
| Lead Generation | 14 | ₹4,07,727 | 55.5% | 4,368 |
| Sales / Conversion | 15 | ₹1,86,136 | 25.3% | — |
| Other (Awareness, Traffic, Engagement) | 15 | ₹1,40,424 | 19.1% | — |
| TOTAL | 44 | ₹7,34,287 | 100% | 4,368 |
ROI / ROAS Analysis
Return on advertising spend, calculated as total gross revenue divided by total advertising cost.
| Metric | Value |
|---|---|
| Total Gross Revenue | ₹35,10,134 |
| Total Ad Spend | ₹7,34,287 |
| ROAS Ratio (Revenue ÷ Spend) | 4.78x |
| ROAS Percentage | 478% |
| Revenue Surplus over Ad Spend | ₹27,75,847 |
Region-wise Performance
Lead generation cost and volume by market, India and overseas.
| Region / Market | Spend | Leads | Cost / Lead |
|---|---|---|---|
| Gujarat | ₹2,15,093 | 697 | ₹309 |
| Maharashtra | ₹1,46,295 | 1,118 | ₹131 |
| Karnataka | ₹41,304 | 354 | ₹117 |
| West Bengal | ₹39,147 | 236 | ₹166 |
| Uttar Pradesh | ₹38,717 | 307 | ₹126 |
| Delhi | ₹33,900 | 278 | ₹122 |
| Rajasthan | ₹29,036 | 195 | ₹149 |
| Haryana | ₹27,305 | 202 | ₹135 |
| Madhya Pradesh | ₹19,105 | 189 | ₹101 |
| Telangana | ₹17,736 | 175 | ₹101 |
| Tamil Nadu | ₹13,506 | 122 | ₹111 |
| Singapore | ₹17,690 | 12 | ₹1,474 |
| Dubai | ₹15,918 | 41 | ₹388 |
Key Takeaways
- Website ticketing and Meta Ads together drove a combined ₹35L+ in gross revenue at a 4.78x ROAS.
- Exhibition & Panel Discussion Passes were the single largest revenue line, with 248 passes sold.
- Investor Passes delivered the highest revenue per pass across all products.
- Lead Generation campaigns accounted for 55.5% of total ad spend and produced all 4,368 Meta leads.
- Maharashtra and Gujarat were the top two markets by lead volume within India.
- Exhibitor stall sales (Platinum, Gold, Silver) added ₹19,08,650 in incremental revenue.
Ready to Scale Your Brand with Performance Marketing?
Partner with Riofos and turn your marketing campaigns into a scalable revenue engine.
Contact Us